

A full schedule can make it seem like your practice is performing well. Then the month-end reports arrive, and the numbers tell a different story.

Tyson Downs · Founder, Titan Web Agency
We work exclusively with dental practices. We test what we recommend, measure what it does, and tell owners what the numbers actually say, including when it isn't what they hoped.
Production looks strong while collections lag. New patients go up while existing patients quietly stop showing up. The problem usually isn't a lack of data. It's that the numbers are spread across four different reports, making it difficult to see how they fit together.
Which KPIs should a dental practice track?
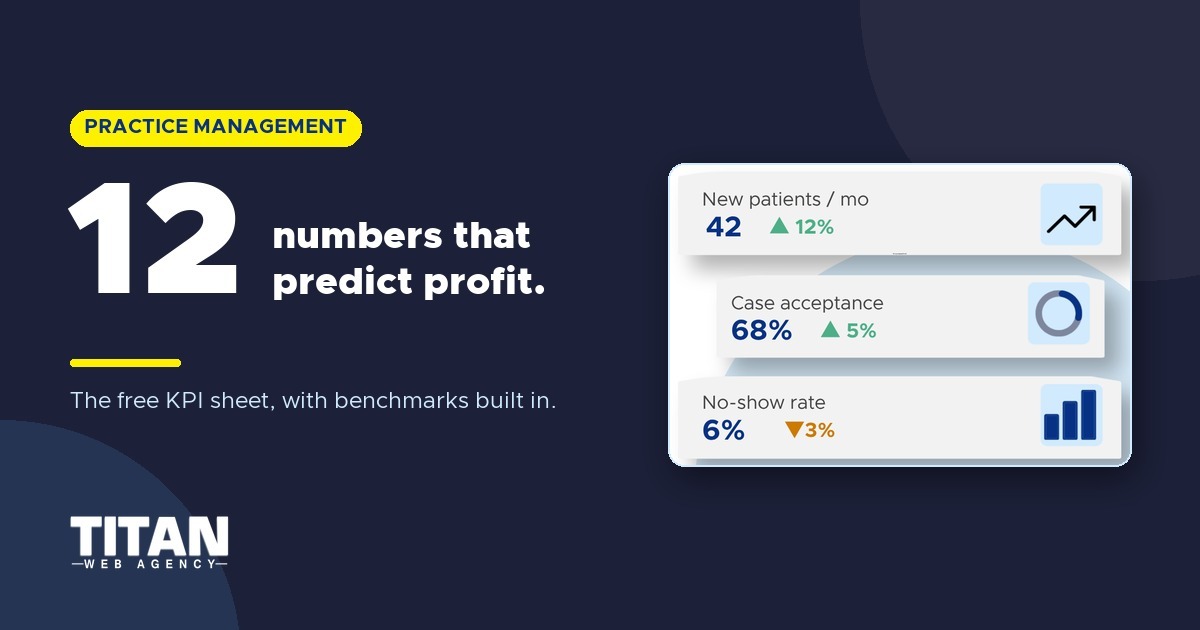
A dental practice should track production, collection rate, overhead, production per visit, hygiene reappointment, no-shows, new patients, patient attrition, case acceptance, cost per new patient, call handling, and revenue per new patient. A dental KPI template brings these numbers together and calculates the KPIs using the monthly reports your practice already produces.
At Titan Web Agency, we work with dental practices every day, and this confusion comes up regularly. We built this guide and the free dental KPI template to put the numbers that matter in one place. Knowing which numbers matter is one part of running a dental practice, and it's the part most owners were never taught.
What's Inside the Dental KPI Template for Excel and Google Sheets?
Once a month, you enter 19 raw figures. Most come straight from your practice management software: production, adjustments, collections, visits, hygiene numbers, appointments, new patients, active patients, and treatment presented and accepted. Operating expenses and marketing spend come from your profit and loss statement. Four figures come from call tracking, website forms, or your front-desk log.
If you don't have call tracking yet, leave those four blank. Everything else still works, including new-patient production, which comes from your practice software.
The four tabs and what you do with each
- Start Here defines every figure, explains where to find it in Dentrix, Eaglesoft, Open Dental, or Curve, and flags the mistake people usually make when recording it.
- Monthly Inputs is where you enter your data. Twelve rows, one per month. It's the only tab you touch.
- The Your KPIs tab calculates each result and color-codes it. Five metrics have a published industry benchmark and are scored against it. The rest have no reliable universal figure, so they're scored against your own 12-month average rather than a number we invented. A year-to-date section below updates as you go.
- The Benchmarks and Sources tab lists each formula, the benchmark, and where it came from.
You don't need to work out any percentages first. If you presented $100,000 in treatment and patients accepted $70,000, enter those two numbers, and the template returns a 70% case acceptance rate. Same for collection rate, overhead, production per visit, cost per new patient, and lead-to-appointment conversion.
Several benchmarks below are from the American Dental Association's Measuring Success guidelines, including collection rate, overhead, new-patient growth, case acceptance, hygiene reappointment rate, and cancellation rate.

Free Template
Everything on this page, already built into a sheet
You don't have to construct it. Type last month's numbers into the light blue cells and the dashboard fills itself in.
A Google Sheet. Make a copy and start typing.
Financial KPIs: Is the Practice Actually Making Money?
These three tell you whether completed work is turning into collected revenue and sustainable profit.
1. Production
Production is the value of dentistry completed in a period. Enter gross production and adjustments separately, and the template subtracts one from the other to give you adjusted production. That distinction matters, because write-offs disappearing inside a single number is how practices convince themselves they had a strong month.
The 2025 Dental Economics and Levin Group survey put average production per doctor at $1,004,178, including hygiene. Treat that as a reference point. Provider count, fees, specialty, and treatment mix all affect that figure.
Compare production against your goal, the same month last year, and your 12-month average. If it falls while visits hold steady, look at procedure mix and treatment planning before assuming you need more patients.
2. Collection Rate
How much of the dentistry you completed actually reached your bank account? Divide collections by whichever production figure your practice uses, and always name that figure.
The ADA recommends collecting at least 98% of billable or adjusted production. Dental CPA firm Adams Brown benchmarks collections against net production and targets 99% to 103%, which is why their number can exceed 100%. These aren’t competing standards. They use different denominators. The template uses adjusted production.
If the rate stays low, check patient portions, insurance follow-up, denied claims, and old balances.
On accounts receivable aging, the total balance matters less than how old it is. The 90-day bucket shows money sitting unpaid for at least three months, and recovery drops sharply the longer it sits.
3. Overhead Percentage
In the 2025 Levin survey, 62% of dentists named rising overhead as their biggest challenge. It was the third consecutive year that overhead topped the list.
Overhead is the share of collected income spent running the practice, excluding owner-doctor compensation. The ADA recommends 63% or less. Percentology's review of more than 100 general practices found that most practices operated with overhead between 61% and 67%.
Get this figure from your P&L. If overhead climbs while production and collections stay flat, compare payroll, supplies, lab, and facility costs against prior periods. Find what changed before you start cutting across the board. Most of the time it's one or two line items, not everything.
Overhead reads best alongside other figures. Dental practice financial benchmarks cover wages as a share of collections, attrition, and production per hour. If you need help interpreting your P&L, consider working with a dental CPA.
Operational KPIs: Is the Schedule Working as Hard as You Are?
A packed schedule can still underperform. These three show whether your available chair time is being used productively.
4. Production Per Visit
Busy and productive are not the same thing. This metric divides adjusted production by completed visits, and it's the number that tells you which one you had.
No reliable target fits every practice. A hygiene-heavy month looks nothing like one with several implant cases. Build a baseline from your last 12 months, then compare like with like.
A falling result alongside a full schedule usually points to a lower-value schedule mix or treatment diagnosed and never scheduled. Adding hours is the last resort. Increasing productivity in a dental office almost always starts with what's already on the schedule.
5. Hygiene Reappointment Rate
Patients usually rebook at the chair or during checkout. If they leave without an appointment, many won’t rebook on their own. This measures the percentage of hygiene patients who leave with their next recare visit already booked.
The ADA recommends having 90% of recare patients scheduled for their next appointment. Pull it from your recare or continuing care report, not the total appointment schedule.
When it drops, your recall list grows, and hygiene production follows within a couple of quarters. Make reappointment part of checkout, and give your team a process for patients who can't commit to a date.
6. No-Show and Cancellation Rate
The no-show and cancellation rate is calculated by dividing missed and late-canceled appointments by all scheduled appointments. Use a consistent definition of "late" so the number means the same thing month to month.
The ADA identifies 5% or less as healthy. Most systems report this in the scheduling or broken appointment report.
A no-show and a cancellation you had time to refill are different problems. Treat them that way. If the preventable gaps are growing, look at your confirmation process and your short-call list before anything else. Dental scheduling software automates most of that workflow, but someone still has to own it.
Patient KPIs: Are You Growing or Just Replacing Patients?
New-patient growth means much less when a similar number of existing patients drift away just as fast.
7. New Patients Per Month
Count patients who completed a first appointment, not everyone who called or booked.
The ADA points to 10% to 15% growth in new-patient volume annually. That's a yearly reference, not a monthly target, so the template compares each month against your own average instead. Your monthly goal should reflect provider capacity and how many patients you lose in a typical year.
In the 2025 Levin survey, 36% of dentists named too few new patients among their top challenges, up three places from the previous year.
If volume drops, break it down by source before changing anything. A decline in patients from Google needs a different response than leads that arrive and never book.
8. Patient Attrition
Attrition is the percentage of active patients who stop returning. Decide whether inactivity starts at 12, 18, or 24 months without a completed visit, then stay with it. Which one you pick matters less than not changing it later.
This one needs a full year, so it sits in the template's year-to-date section rather than the monthly dashboard. It takes your active patient count in January, adds the new patients you gained, and subtracts your active count in December. The difference is what you lost.
Read it next to new patients. If 30 new patients arrive while 25 existing ones leave, your net growth is five, not 30.
If attrition climbs, look at unscheduled hygiene appointments never rebooked and incomplete treatment follow-up.
9. Case Acceptance Rate
Case acceptance compares treatment accepted against treatment presented, in dollars. Pick one definition of "accepted" and stay with it.
The ADA uses 75% to 80% as a target. Most offices land closer to 60% to 70%, partly because systems count acceptance differently. Some count treatment scheduled the same day, others count it once one phase is booked. (That one catches people out when they compare notes with a colleague.) Treat 75% to 80% as the goal, not the average.
Pull the figures from your treatment plan report and track same-day acceptance separately. When the rate falls, check whether patients understood the diagnosis, the consequences of waiting, the cost, and their payment options. That's usually the problem, not a patient who didn't want the care.
Marketing KPIs: Is Marketing Bringing in Patients or Just Traffic?
Traffic and leads give you context. These three tell you whether marketing is producing patients and revenue.
10. Cost Per New Patient
Leads don't pay for crowns. That's why this beats cost per lead: total marketing spend divided by completed new patients.
Pull your marketing spend from your P&L and your new-patient count from your practice software. The template gives you a blended figure across all your marketing channels. Breaking it down by channel requires source tracking, which your practice software won’t do on its own. It’s worth setting up once you have the basics in place.
There's no universal healthy number. Compare it against what a new patient is worth in their first year. A $400 acquisition cost is poor for a one-time low-value visit and excellent for an implant patient.
11. Call Answer Rate and Lead-to-Appointment Conversion
Two measurements, one question: "What happens to the demand you're already paying for?" Answer rate is answered eligible calls divided by eligible calls. Lead-to-appointment conversion is calculated by dividing booked appointments by qualified inquiries. Exclude spam and existing-patient admin calls, or the numbers will flatter you.
Call tracking shows you missed calls, where they came from, and what happened after.
When lead volume looks healthy, but appointment bookings don’t, listen to what happens after the phone rings. Check response time, insurance conversations, scheduling availability, and whether your team asks for the appointment. More advertising won't fix an intake problem. It sends more leads into the same leak.
12. Revenue Per New Patient
Revenue per new patient is calculated by dividing new-patient production by completed new patients. It answers the question that cost per new patient can’t: "What did those patients actually produce?"
Pull new-patient production from your practice software. The template tracks first-visit value, which is what you can measure the same month. First-year value tells you more, but it needs cohort tracking over time rather than a monthly figure.
If acquisition cost holds steady but revenue per patient drops, look at lead quality, service mix, case acceptance, and scheduling. A channel that brings fewer patients can still be the better channel when those patients accept higher-value treatment.
Dental KPI Benchmarks at a Glance
Use this as a starting point, not a scorecard. Healthy ranges shift with specialty, location, payer mix, fees, provider count, and how mature the practice is.
| KPI | How to calculate it | Starting benchmark | Source or basis |
|---|---|---|---|
| Adjusted production | Gross production less adjustments | Your 12-month average | No universal figure applies |
| Collection rate | Collections ÷ adjusted production | 98% or higher | ADA |
| Overhead | Operating expenses ÷ collected income | 63% or lower; 61% to 67% typical | ADA and Percentology |
| Production per visit | Adjusted production ÷ completed visits | Your 12-month average | No universal figure applies |
| Hygiene reappointment | Reappointed ÷ completed hygiene patients | 90% or higher | ADA |
| No-show and cancellation | Missed and late-cancelled ÷ scheduled | 5% or lower | ADA |
| New patients | Completed first visits | Your 12-month average | ADA: 10% to 15% annual growth |
| Patient attrition | Year-to-date; needs January and December active counts | Your own trend | No universal figure applies |
| Case acceptance | Treatment accepted ÷ presented | 75% to 80% target; 60% to 70% typical | ADA and CPA benchmarks |
| Cost per new patient | Marketing spend ÷ completed new patients | Your 12-month average | Compare to first-year value |
| Call answer rate | Calls answered ÷ eligible calls | Your 12-month average | No universal figure applies |
| Lead-to-appointment | Appointments booked ÷ qualified leads | Your 12-month average | No universal figure applies |
| Revenue per new patient | New-patient production ÷ new patients | Your 12-month average | Compare to acquisition cost |
How Often Should You Update Your KPIs and Who Should Own It?
Review schedule activity and call handling weekly. Update the full dashboard monthly, once production, collections, marketing, and P&L reports are in. Look at longer-term movement quarterly.
| Metric group | Frequency | Suggested owner |
|---|---|---|
| Calls, bookings, no-shows, schedule gaps | Weekly | Office manager or front desk lead |
| Production, collections, new patients, reappointment | Monthly | Office manager |
| Overhead and new-patient revenue | Monthly or quarterly | Owner with bookkeeper or CPA |
| Targets and 12-month trends | Quarterly | Owner and leadership team |
The office manager usually gathers the numbers. The owner interprets them and decides what to do. Your team should see the metrics they can directly affect, which usually means reappointment rate and no-shows.
Keep ownership specific. A template assigned to "the team" belongs to nobody and quietly falls out of use within a few months.
How Do You Know If the Problem Is Marketing or Operations?
Don't judge any KPI in isolation. The pattern across several of them is what identifies the problem. Three patterns cover most practices:
- Inquiries hold steady but completed first visits are falling. The demand exists, and you're losing it between the inquiry and the appointment. Check call answer rate, lead-to-appointment conversion, scheduling availability, and no-shows.
- New-patient visits look healthy, but production stays flat. You're attracting enough people and either losing them or not scheduling the care you've recommended. Check production per visit, case acceptance, hygiene reappointment, and attrition.
- Patient growth and production both look fine, but profit still shrinks. Neither funnel is broken. Review collection rate and overhead before blaming marketing or the front desk.
If the leak sits at the front end, with visibility or patient acquisition, our practice analysis can show you where patients are being lost.

Frequently Asked Questions About Dental Practice KPIs
What KPIs should a dental practice track first?
Start with production, collection rate, overhead, new patients, and case acceptance. Between them, you get a workable first read on financial performance, growth, and treatment conversion.
Why is my schedule full but my profit flat?
Check production per visit, collection rate, and overhead. A full schedule can be full of low-value visits, or the production is happening and not being collected.
What is a good collection rate for a dental practice?
At least 98% of billable or adjusted production, per the ADA. Check which denominator your report uses before comparing.
What should dental practice overhead be?
63% or less of total income, excluding owner-doctor pay. Most practices run 61% to 67%.
What is a good dental case acceptance rate?
The ADA target is 75% to 80%. Most practices land nearer 60% to 70%. Only compare results when both define accepted treatment the same way.
How do I know if the problem is marketing or my front desk?
Compare inquiries against booked appointments. Healthy inquiry volume with weak booking points to intake, not marketing.
How many new patients per month does a healthy practice need?
There is no universal number. The ADA points to 10–15% annual growth in new-patient volume; the right monthly figure depends on provider capacity and how many patients the practice loses in a typical year.
How often should you review dental KPIs?
Weekly for schedule and calls, monthly for the full dashboard, quarterly for trends. Keep the dates and definitions consistent.
Who should track KPIs in a dental office?
The office manager gathers the figures. The owner reviews them and decides who owns each fix.
Ready to Find Out What Your Numbers Are Telling You?
The template brings your numbers together so you can see where performance is improving and where patients or money are slipping away. Start with last month and see which cells turn red.
If those numbers point to a patient acquisition problem rather than an operations one, that's the part we handle. Titan Web Agency works exclusively with dental practices, and our tracking connects marketing activity to calls, scheduled patients, and revenue. Schedule a practice analysis, and we'll show you where patients are being lost.
Free strategy call
Not sure what your dental KPIs are really telling you?
If your numbers point to a patient-acquisition problem, we'll help you identify where potential patients are being lost and what to focus on next.
Book a Free 15-Min Strategy CallNo pitch. No pressure. Clear next steps.

.png)
.png)
Tyson Downs is the founder of Titan Web Agency, a company specializing in marketing for dental professionals. With an impressive track record of working with over 100 dental practices, Tyson has a deep understanding of the unique marketing needs within the dental industry.

.svg)